Note:
If you guys are getting coupon expired or course is not free after opening the link, then it is due to the fact that course instructors provide only few hundreds or thousands of slots which get exhausted. So, try to enroll in the course as soon as it is posted in the channel. The Coupons may expire any time for instant notification follow telegram channel


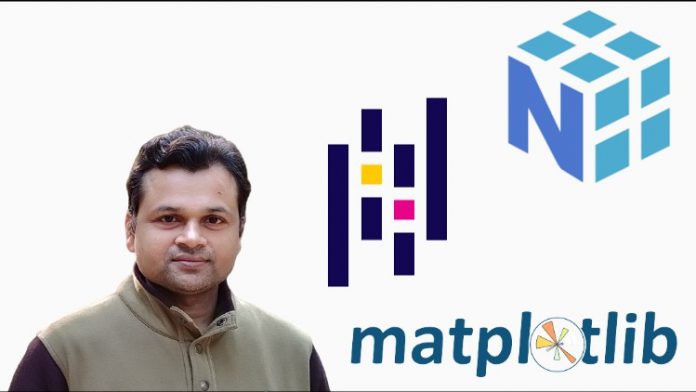
If you are looking to make a career as a Data Scientist, Data Analyst, Machine Learning Expert using Python, then Numpy, Pandas and Matplotlib library is very important to learn in today’s scenario. In this course you will get a detailed explanation of topics and functions related to Numpy, pandas and matplotlib library. After this course, you can able to do Data Manipulation and Data Visualization. You can say these tools are the ladder for the Data Scientist.
Important Feature of this course is as follows:
1. Every topic is covered practically.
2. Explained in very easy language.
3. Non-Programming background can also understand easily
4. Demonstrated in a simple way so that you can do the same by watching videos.
For Data Science aspirant, this is the best course. Nowadays Data Visualization is an important tool to take decisions in organizations. Here using matplotlib library you can easily visualize the data using histogram, bar chart, pie chart, scatter diagram and many more.
Topics Covered in Numpy:
1. Numpy Array
2. Numpy indexing and Slicing
3. Copy vs View
4. Numpy Array Shape, Reshape
5. Numpy Array Iterating
6. Numpy Array joining and Merging
7. Splitting , Searching and Sorting
8. Filtering
9. Random Module
Topics Covered in Pandas:
1. Series
2. DataFrame
3. Import Files/Dataset
4. Merging , Joining and Concatenating
5. Analyzing Data
6. Cleaning Data
7. Data Manipulation
Topics Covered in Matplotlib:
1. Importance of Data Visualization
2. Type of Data Visualization
3. Concepts of matplotlib Library
4. Line Plotting
5. Histogram
6. Bar Plot
7. Scatter Plot
8. Pie Chart
9. Box Plot
10. Area Chart
[


![Passive Income: Create & Sell Online Courses [Full Course]](https://oyoads.in/wp-content/uploads/passive-income-create-sell-online-courses-full-course_661cb1a9a14ff-218x150.jpeg)
![AI for Business Strategy & Planning [Masterclass]](https://oyoads.in/wp-content/uploads/ai-for-business-strategy-planning-masterclass_661cb19898162-218x150.jpeg)


![[100% Free]Learn Machine Learning From Scratch Practically](https://oyoads.in/wp-content/uploads/2020/05/3069438_59ea-218x150.jpg)


![[100% Free]Python Bootcamp 2020 Build 15 working Applications and Games (31.5 Hours)](https://oyoads.in/wp-content/uploads/2020/05/Python-Bootcamp-2020-Build-15-working-Applications-and-Games-1-100x70.jpg)

![[100% Free]Java Programming: Complete Beginner to Advanced](https://oyoads.in/wp-content/uploads/2020/05/IMG_20200519_054150_522-100x70.jpg)
